

Frequently Asked Questions
How did you select which data to map?
To develop a manageable set of data we had to select from a vast array of archive information. This blog post describes the process of narrowing the focus by selecting a time period, a region and a sub-set of maps.
The Bomb Sight is using the Bomb Census Maps as the primary data in the tools we are developing. The maps are part of an extensive array of material collected during the Bomb Census Survey 1940 to 1945, organised by the Ministry of Home Security. The records are held in The National Archive (TNA), and we are using the maps with a non-commercial education licence.
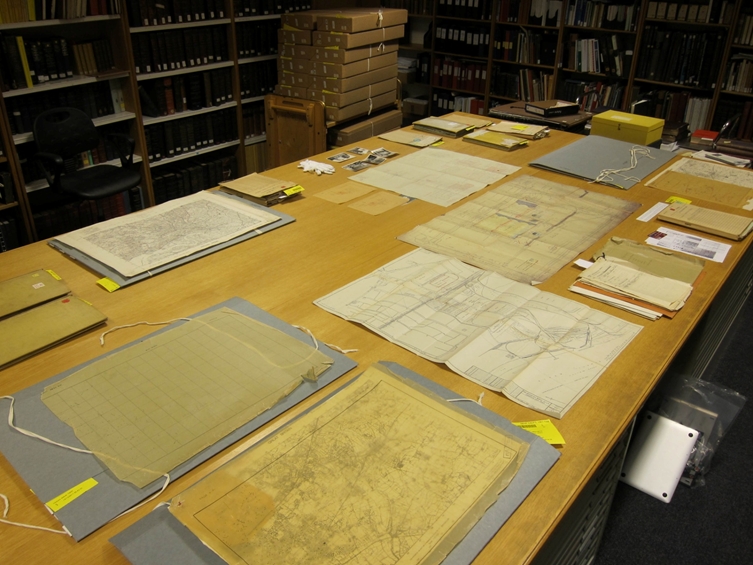
Due to the sheer volume of records, photos, documents and information collected during the Bomb Census Survey – the project had to carefully select data to prevent information overload which might mean we miss our completion deadlines. For this reason we spent some time before Christmas at the Archives with one of TNA’s map archivists Andrew Janes. The image shows a snapshot of the types of documents collected during the bomb census. The array of information had the purpose of providing the government with a complete picture of air raid patterns, types of weapon used and the damage caused (TNA, 2011).
How Did You Select a Time Period to Use?
To select a manageable data set we first decided to restrict the time period of the project to the period of the most intensive bombing known as The Blitz. The word ‘Blitz‘ is derived from the from the German term ‘Blitzkrieg’ (lightning war) and is associated with a period of continued aerial bombing by the Germans on Britain (Imperial War Museum, 2011). The Blitz started on the 7th September 1940 and continued until the spring of the following year. The maps in the archive do not completely align with the time period of the blitz so there is a slight mismatch but the reporting period we are investigating is between October 7th 1940 and June 1941 as this is the period in which data were collected.
How Did You Select Your Study Area?
 During the war Britain was divided into Civil Defence Regions – of which there were 12. London was recorded as region 5 and was sub-divided into 9 Civil Defence Groups. The project will be exploring Bomb Census Maps from across Region 5.
The other regions were as follows:
- Northern Region
- North Eastern
- North Midland
- Eastern
- London
- Southern
- South western
- Wales
- Midland
- North Western
- Scotland
-
South Eastern
Selecting the Bomb Maps
The primary focus of the project is not about digitising maps but about clustering different data. Therefore having selected a time period and a study area the final step was to select which of the archive data to use. We have selected to look at two types of map from the HO193 map series in order to (1) obtain an aggregate view of all the bombs dropped during the period of interest and (2) see in detail the first week of the reporting period.
Aggregate maps of nightly Bomb Drops during the period October 7th, 1940 to 6th June, 1941 (archive record: HO193/13)
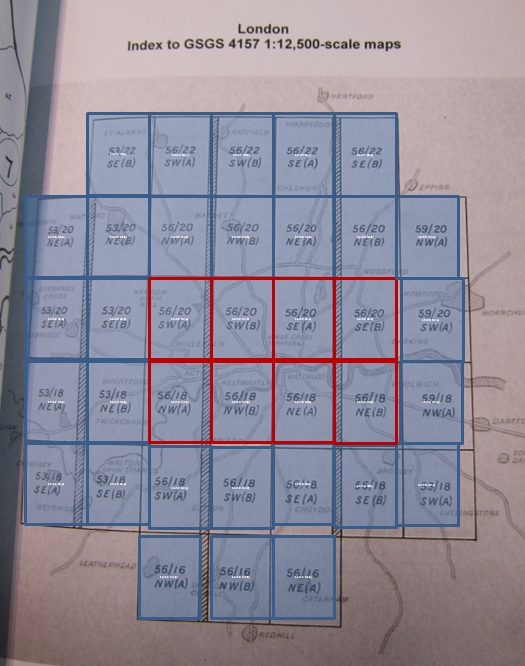
- maps are at a scale of 1: 12:500 and there are number of maps at 1:25000 for central London – as per the images shown (HO193/13).
- The London Region (Civil Defence Region 5) is divided into a series of tiles (map sheets) based on the Military Grid Projection System (MGPS).
- There are 35 different map sheets in the archive that cover each of the tiles.
- For each bomb dropped a point on the map has been recorded to show the location of where it fell
- The maps were labelled SECRET but declassified in 1971.
-
The original maps are very fragile due to the quality of paper available at the time.
Weekly plots showing day of week and bomb type: First week of the available reporting period : 7th – 14th October 1940 for Central & East London only (archive record: HO193/01)
- 2.5 inch map sheets for each week
- Plots showing all the bombs that fell that week
- For the period of the Blitz there are 559 map sheets
- The project will use weekly bomb plots for the First week of the reporting period- for Central and East London (7th to 14th October 1940) (HO193 / 01)
- This will provide an overview of daily intensity and proof of concept to hopefully enable the remaining weekly maps to be integrated
- Maps record point of impact, a symbol is used to classify the type of bomb
- Each point of impact is in a different colour to denote the day of the week in which the bomb fell.
- The maps do not record size of bomb


